GCPs in Remote Sensing
Going forward, this blog post will pertain to the acute methods of how to appropriately use GCP points in the Pix4D software. Ultimatly, the discussion and conclusive data will be primarily focused on comparing an image product that uses GCP points, and the same data without any GCP points. The final result will be a set of maps, which will be the bases of comparison.
Along with describing the process of incorporating GCPs into imagery obtained using GeoSnap will be an overview of the common methods there are associated with using GCP points in Pix4D. In total, their are three and each have an their own advantages and disadvantages. Often times, depending on the method, you are subtracting accuracy for time, or vise versa.
Methods
How to Integrare GCPs into a Project
Source of geographic accuracy can be called upon by utilizing a multitude of geo-accurate data sources. There is the topographic method, which is the survey method, where points are taken in the field with hardware and and imported into pix4D and combined with the imagery. Then, there is the method that utilizes data that is already considered to have a geographic level of accuracy. Sources for this can be topographical - navigation maps. The final method, utilizes the accuracy from a Web Map Service.
Regardless of how these points are acquired, there are 3 distinguishable methods of how to use GCPs in pix4D. The factors to concicer when using GCPs, are as such:
- If the initial images are geolocated or not
- The coordinate system of the original images
- The coordinate systems of the GCPs
Method A: images and GCPs have known coordinate systems
This method is the most common. It allows one to mark the GCPs on the images with little manual input. As such. this method is not suited for "over night" processing where all processing steps are initiated at once and can be ran all at once.
- obtain GCP measurments from a device in the field
- Import GCPs using 'GCP / Manual Tie Point Manager'. Often times, the GCP attribute data requires that the data be massaged to the right format in order for it to be available for use
- On the menu bar, click Process > Local Processing.
- Activate Initial processing
- Deactiveate the Point Cloud Mesh and DSM, Orthomosaic and Index options
- Click Start
- Mark GCPs with Ray Cloud
- Analyze quality report
Method B: Initial image has no geolocation, initial images are geolacted in arbitrary coordinate system, or the GCPs are in an arbitrary coordinate system.
Method B allows users to mark the GCPs on the images with little user input, like in Method A. However in this case the the images are not geolocated and the the GCPs are geolocated useing an arbitrary coordinate system. Also, this method is not suited for "over night" processing where all processing steps are initiated at once and can be ran all at once.
- Obtain your GCP measurements and have the in a proper location
- allocate them to the proper coordinate system that best fits project
- On the main menu bar, click process > local processing and only select: 1. Initial Processing. Do not select Point Mesh Cloud or Orthomosaic and Index.
- Click start
- Add/import 3 GCPs with the Ray Cloud tool.
- add extra GCPs obtained from field or tabular data into the software with ray cloud or GCP/Manual Tie Point.
- Remark All the GCPs with Ray Cloud.
- Complete the final processing steps needed to complete the project (Point Mesh Cloud or Orthomosaic and Index).
Method C: Applies to any case
Method C works for all cases and it does not matter what the coordinate sytem of the images or the GCPs are but it requires more user input to work the GCPs in the Images. The advantage of this method is that after importing the images and the GCPs, the processing can be done without any user input or attention and be left to conduct its long processing operations .
The method the user selects is contingent upon what resources he/she has available and also the nature of the data they are working with. If the image has an assigned coordinate system, than the GCPs georefrence must match that of the imagery. However, if the image has no georeference than the user can choose a use an arbitrary coordinate system for the GCPs.
Method C works for all cases and it does not matter what the coordinate sytem of the images or the GCPs are but it requires more user input to work the GCPs in the Images. The advantage of this method is that after importing the images and the GCPs, the processing can be done without any user input or attention and be left to conduct its long processing operations .
- Obtain your GCP measurements and have the in a proper location
- allocate them to the propper coordinate system that best fits project
- Add/Import all of the GCPs with GCP/Maual Tie Point Manger
- Mark the the GCPs on the image with the BASIC GCP/Manual Tie Point Editor.
- Click ok to close the GCP Editor.
- Begin the "over night processing" of creating by running all three processing steps at once.
Steps of Creating a Pix4D Prooject using GCPs with GeoSnap Imagery - An Overview
To create two comparable projects, one with GCPs and one without, for the project with GCPs, Method A was the method that was used. However, before getting involved with the GCPs, there are several steps the user must preform in conjunction with GeoSnap data so that its images can be used by Pix4D.Normalizing the picture in the georefrencrence file is the first step in this process. Unlike when using the Cannon SX290 images in previously labs, the GeoSnap imagery does not get uploaded into Pix4D with attributed spatial information assigned to it automatically. Like with the GEMs, you must join the imagery with the Export file that is created when exported into Pix4D. This file contains the rows and columns of spatial information that is needed to create a Pix4D project. However, before these files can be used to accurately provide geolocation, the data must be massaged. This is process is similar to normalization, but instead of having the correct name, all that matters is that you have the correct order of your columns. Figure 1 below shows what the massaged data looked like.
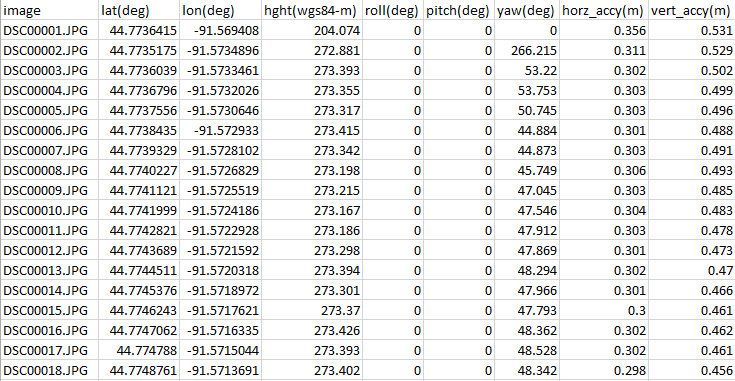 |
| figure 1: Table in the appropriate format that can be read by Pix4D software. |
To create this new formated table, the file was exported to Excel, where the columns were massaged in the right, proper order, and than reconverted back to text for use in Pix4D . Once this process is complete, the images can now be assigned accurately using the massaged table.
Next, the user must adjust a few parameters within the coordinate system advanced options. The user must select Geod Height Above WGS 84 Ellipsoid ( 0.00) for the vertical coordinate system. The default coordinate system for the images is WGS. However, a few steps later, the user is advised to select MSL (mean sea level) for the output coordinate system because that way it can be compared to USGS Data which typically uses MSL for there data format.
Now, the user can import their GCPs. First, its impartive that the Geographic Coordinate System of the imagery and the GCPs are the same. In this case, although the GCPs being imported into the software are in UTM Zone 15N, they still are still attributed the GCS geoid. Once all requisit coordinate information is input into the system, the GCPs will display in the the GCP/Manual Tie Point Manger with all fields populated. By clicking Next, THE GCPs will than appear on the viewing interface, above the imagery, displayed as X's. Once GCPs are in the system, initial processing can be ran. This processing took roughly 2 hours to complete.
Once complete. Ray Cloud editor opens up allows users the ability to further increase the accuracy of their imagery. When editing with the Ray Cloud Tool, the user can see a legend of all the GCPs and images that are associated with those GCPs on the left, and a smaller image pan on the right opens if one of the GCPs in the legend is selected. When this imagery was taken, the data collectors place orange and white icons at the precise locations of the GCP points. Using that in the right doc imagery pane, the user can adjust the GCP point location so that is more directly Centered at the center of the geoaccurate spot. Figure 2 below shows what this pane looked like during the process of adjusting the GCP points. Each GCP had anyware between 17-25 images that captured it in part of the flight mission. The user has to go through and adjust the GCP location for every image that is is found in, to create the most accurate product.
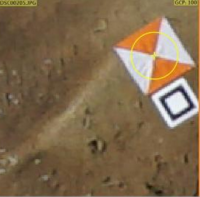 |
| Figure 2: The yellow cross hairs represents the GCP location and the orance and white structure represeant the a Geo-Accurate point. The GCP will oftentimes not be centered at this point, and will be off of the point by several meters. The user, like displayed in this picture, clicks and centers GCP point so that it is as close to the center of the geo-accurate marker as possible. |
This process is very simple though, and by zooming closer in on the image pane, the user can pinpoint the points with a higher degree accuracy.Once all of the images associated with each GCP is is adjusted using Ray Cloud Editor, the final steps of Point Cloud Mesh and DSM/Orthomosaic Index can be ran to complete the Pix4D project.
To create the same project without GCPs, the data was still massaged so that it would fit into Pix4D software, where all adjustments to the reference coordinate systems are done as specified earlier. This time round, however, all processing can be ran at once because no GCPs are being used.
Results
The maps and images shown in figure 3 indicate the different levels of accuracy between the orthomosaic that was created with and without GCPs. The image to the right of the maps shows a geo-accurate ground point that was taken with a survey grade GPS device, the X represents how that GCP was shifted during the projection process. The bottom map/image display what each of the GCP points look like relative to the point on the actual ground. This accuracy is established after initial processing when the Tie Point/ GCP manger was used to adjust the GCP point so that it was as close to center on the ground point.
 |
| Figure 3: Orthomosaics with and without GCP points |
Visibly, just looking at the maps doesn't really give any indication that there is a difference between the two maps, but when looking closer at the geo-accurate point in relation to the digital GCP, you can see that a shift does take place. The mean shifting of each GCP point was roughly .96 meters in any direction. This statistic is made available in the Absolute Geolaction Variance reports which can be refereed to in the next section, within figure 4.
Discussion
Using the quality reports produced by both of these projects, one can observe if there is a difference between Geo-snap data with and without GCPs. As you can see the project with the GCPs produced a higher RMS error for the X, Y, and Z value, in comparison to the project with just raw Geo Snap data. The values being refereed too here, are the values represented in the bottom row of each figure. This is interesting, because the maps created in ArcMap show how the orthomosaic that was realigned with GCPs was spatially more accurate.
 |
| Figure 4: Absolute Geolocation Variance chart from Pix4D quality report - GCP Points |
 |
| Figure 5: Absolute Geo-location Variance chart from Pix4D quality report - Raw Geo Snap data, No GCPs |
Because it is intuitively backwards, The figure that should be payed attention to most is mean (M) shift in geolcation ( figure 4 and 5). Because Pix4D thinks its imagery is the most accurate source, it shows very large mean distance from actual location, for the x,y, and z components of each GCP. Referring to the same statistic in figure 4, that same value represents the mean distance each GCP was shifted to make it so it lined up with the geo-accurate survey point. Each point had to be roughly moved 1 meter to be fit right above the center of the survey point.
Conclusion
Using GCP points shifted the imagery to more accurate ground locations by roughly a meter overall. This shift is not noticeable at small scale comparison, but can be observed when taking a view at much larger scale factor. GCPs are very important tools that provide the means to create accurate imagery data that is in high demand for a number of growing industries. Within industries, like construction and urban planning, being accurate to the meter is not enough. In this world, centimeters measure the difference between a successful day of building and an expensive redo.
No comments:
Post a Comment